


2025 WR Class Preview
Call him Travis the Bounty Hunter, because he’s cashing in on both sides of the ball.

After a few months’ hiatus from writing, I am excited to delve back into fantasy football. It’s been crazy and challenging last few months as my wife and I bought a new home but unfortunately had to find an interim place to live until it was finished being built. Thus, we had to move all our belongings into and out of storage. We are also eagerly awaiting the birth of our second child in the next few weeks, and the days are simply too short to accomplish everything that I want to. However, with summer approaching and the hectic school life that comes with kids begins to slow down, I am hopeful to share a lot of the things I have been working on, and that have taken a backseat, with you as we work through the NFL draft, rookie camp, training camp, and the preseason.
Also, later this summer, likely in July, I will have my two ‘all-in’ player articles where I share my thoughts on two young, unproven players and why I am trying to acquire them at any cost. (I already have one picked out.)
Over the last few weeks, I have spent much of my time retooling and revamping my WR model. For the first time since I built this in 2020, I genuinely feel confident about the results I am getting. This isn’t to say that I didn’t trust my method before, but it feels like every year, there is some new metric that is discovered that is highly predictive, or a metric that is well known that is shown to be not as ‘sticky’ as once thought.
Some of the new changes I made were removing height, BMI, and the 40-times. My WR database dates back to 2017; since then, I have input 494 prospects (I plan to add a few more before the draft). I took some time to research what athletic traits made sense for a WR and if it even mattered at all. Today’s WR can come in many different flavors. Big and fast, slow and agile, etc. Recently, players like Tank Dell have proven that height doesn’t matter. DeVonta Smith threw the BMI arguments right out the window. Amon-Ra St. Brown, Cooper Kupp, and Jakobi Meyers, had slow 40 times. These things don't hold as much weight as they used to. By removing height, BMI, and raw 40-times for wide receivers, it helps avoid overvaluing big or fast players who lack actual on-field effectiveness. These raw traits often favor workout warriors and the athletic freaks, which doesn’t consistently translate to NFL or fantasy success. Instead, I focused on using composite metrics like speed score, RAS, and my custom catch radius formula, which captures athleticism in a more functional, position-specific way — letting true playmakers rise regardless of body type.
I have seen many people go back and forth on whether RAS has any predictiveness for wide receivers as it does for running backs and tight ends. Since 2014, 30 wide receivers have made it to the Pro Bowl. I know the Pro Bowl is seen as a joke, but loosely, we can assume that if a WR makes the Pro Bowl, he probably had a relatively good fantasy season (unless you’re Tyler Huntley). Of those 30 wide receivers, 16 (53%) had a RAS score of 8 or higher. 27 of 30 (90%) had a RAS score of 5 or higher (5 being average level athleticsim). RAS clearly does matter for wide receivers because it encompasses explosiveness, agility, and speed relative to body type. It offers an apples-to-apples comparison, whereas isolating height, weight, BMI, and 40 time can prop up wide receivers who may not be ‘football functional.’
One of the things I added into the model was first down per route run, which has been shown to have a very strong correlation to fantasy success, as highlighted in this article by Ryan Heath. Another change was switching from yards after catch per reception to yards after catch per route run. YAC/REC only tells us how good the player is once they get the ball in their hands, while YAC/RR blends a WR’s ability to separate, get targeted, and create after the catch. I also struggled to see any correlation to future success with a WR’s TD market share numbers, so I created my own weighted TD metric that blends a player’s TD market share and their receiving TDs per team pass attempts. Combining these two metrics gives a more context-aware view of scoring ability and rewards WRs who score efficiently and consistently.
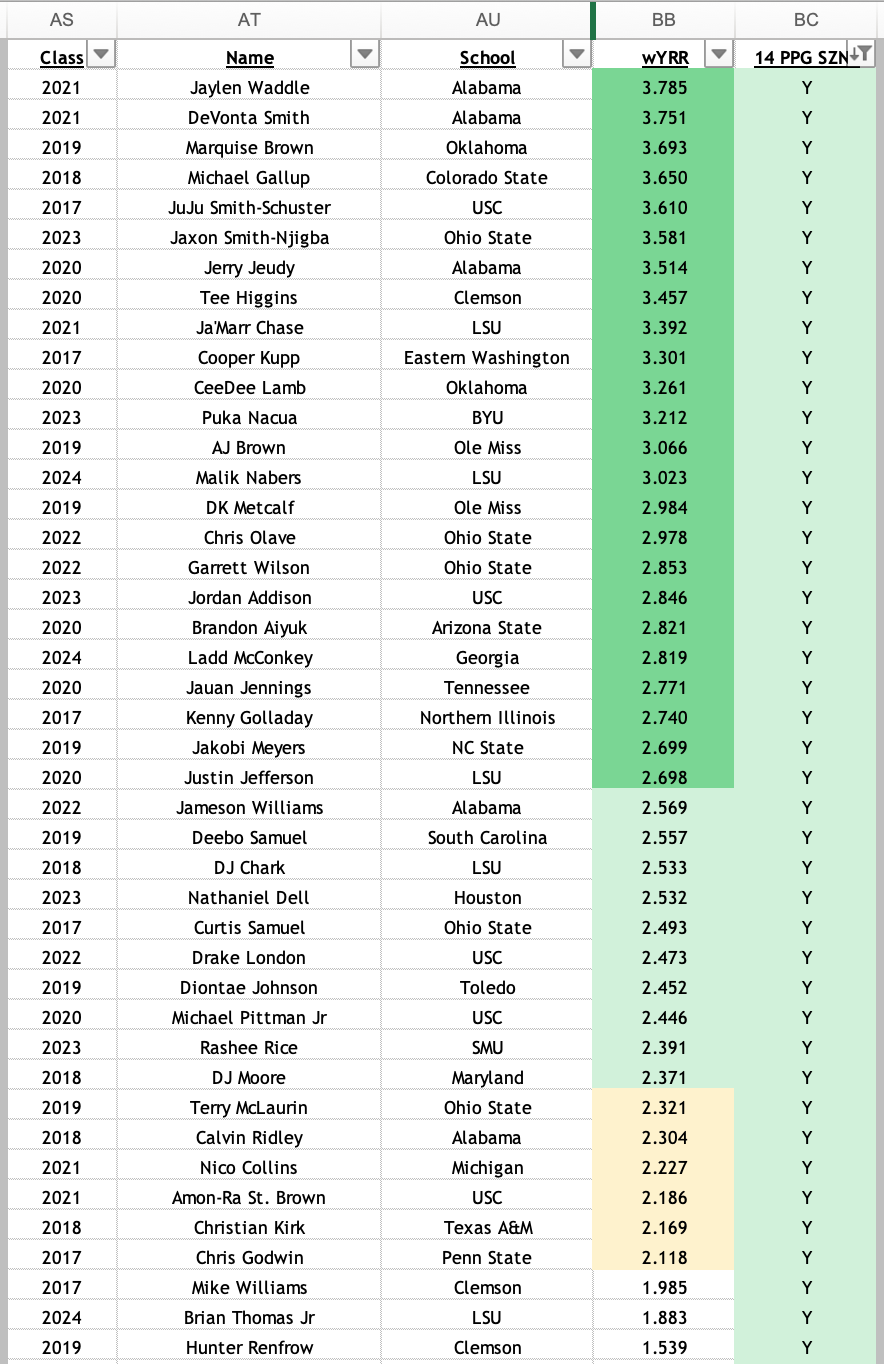
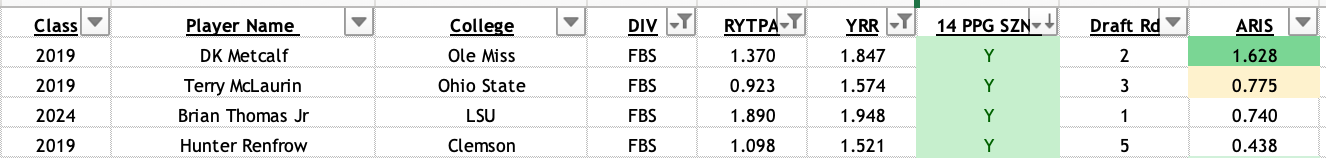
One of the other metrics I use is my custom weighted yards-per-route run formula. wYRR improves on the standard YRR metric by factoring in how often a receiver faced man and zone coverage rather than treating all routes equally. It blends the coverages using the actual number of routes run against each, creating a more holistic view of a player’s efficiency. This approach is more predictive than standard YRR, which can be skewed by inflated production on limited reps or soft coverages. Below is every WR to have posted at least one 14ppg season since 2017. A wYRR of 2.69 or higher is what I consider ‘elite,’ as that is an 80th percentile threshold.
If you have followed my work for some time, you know I have a metric called ARIS, or Aggregate Receiver Impact Score. In short, ARIS is a specialized metric designed to assess the performance of wide receivers. This metric goes beyond traditional statistics like receptions and yardage to provide a more nuanced evaluation of a receiver's overall impact on the game. You can read a full, detailed breakdown of what this metric encompasses here.
What I wanted to do in this article was break down this 2025 WR class through the lens of ARIS and a route running ability metric called Weighted Success Rate Over Expected (WSROE).
First, let’s look at ARIS.
I have 497 prospects in my WR database since 2017 (including the 2025 class). This includes drafted, undrafted, FCS, and FBS players.
Of the 497 prospects, 175 WRs have an ARIS score of 1.000 or greater (35%).
Since 2017, there have been 44 different WRs who have had a season of at least 14 PPG.
38/44 had an ARIS score of 1.000 or greater, and 41/44 had an ARIS score of .7750 or greater.
The grouping of WRs with an ARIS score between .775 and 1.000 might suggest players who could be valuable depth options or potential breakout candidates (stashes). This third tier comprises players with specific roles that limited their ceiling but could still offer fantasy relevance.
Falling below the .775 threshold certainly raises a major red flag on a player’s prospect profile and should be considered the minimum threshold for the players we want to draft. However, a high ARIS score, although not a guarantee of success, indicates potential for fantasy relevance. It signifies that the player was efficient in college and significantly contributed to their team's passing game.
This year, I separated the players with an ARIS score of 1.000+ into two tiers. An elite ARIS score is 1.37+, or an 80th percentile score, and then 1.000+, a 65th percentile score.
The Elite ARIS.
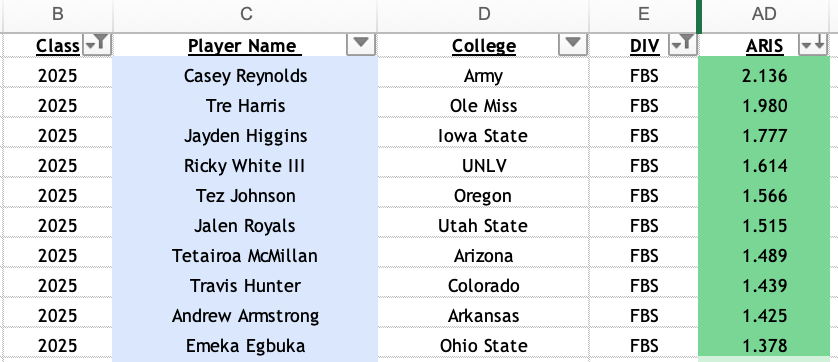
No real surprise here to see the top names with Harris, McMillian, Hunter, and Egbuka.
Casey Reynolds, the Army WR, grades well here simply because he was the entire passing game. If you're a college football fan, you know that the Army runs an archaic wishbone offense and only threw the ball 119 times this year. If he is surprisingly picked before the end of round seven (which I don't foresee), he’s probably worth a bench stash, but otherwise, I wouldn’t bother.
Andrew Armstrong is another name that came a little as a surprise on here; however, I am intrigued to see if he can land day two draft capital. He has a very strong profile from his two years at Arkansas. He has a 2.48 wYRR, .110 1D/RR, a very strong 37% receiving yards market share to go along with a 33% weighted dominator. Before transferring to Arkansas, he played two years at Texas A&M Commerce, a Division I FCS school. He broke out as a sophomore at Commerce, catching 62 passes for 1020 yards and 13 TDs. He is, unfortunately, an older prospect at 24 years old and will turn 25 this October as the NFL season begins.
Still very good, just not ‘elite’.
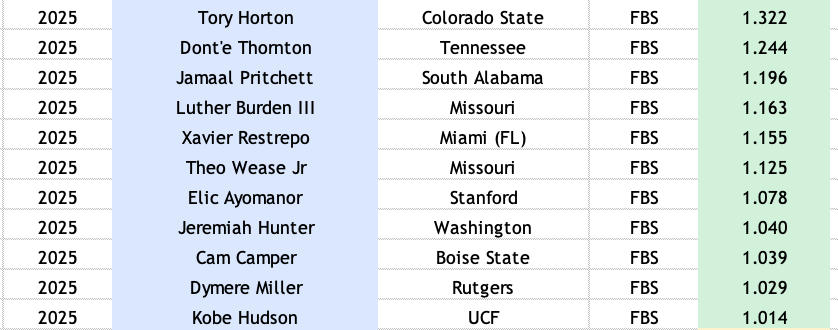
Remember, anything above 1.000 is excellent. I just wanted to separate those who excel in this metric by setting that 80th percentile tier break.
14 wide receivers scored above 1.000 last year, and this year, there are 21.
My takeaway from this is that although last year’s class featured more top-end elite talent like Harrison Jr, Nabers, BTJ, and Odunze, this year's group may offer more quality WR2s and more depth options instead of true star power.
Tory Horton is one of my favorite WR sleepers in this class.
author, Andrew Woodruff, can attest to this, as he’s been on our radar for a few years now.
Dont’e Thornton makes this list strictly because of efficiency. Thornton rarely saw the ball come his way, only reaching 20+ receptions in a season once in his four-year career. However, he has a ridiculous 21.9 yards per reception and scored a TD on almost 10% of his receptions. If you’re a fan of Marquez Valdes Scantling, then you’ll love Thornton. Unless he lands in the perfect spot with day-two draft capital, I am not buying this profile.
Burden and Ayomanor also land in this group, and both are projected to be day-two picks. There has been a lot of chatter about Burden’s commitment to the game in terms of his in-game effort. Hopefully, a team can extract the best out of him. Ayomanor has a good prospect profile, but his route tree is very questionable. He will need time to develop and could be closer to a year-three breakout candidate than an impact player out the gate.
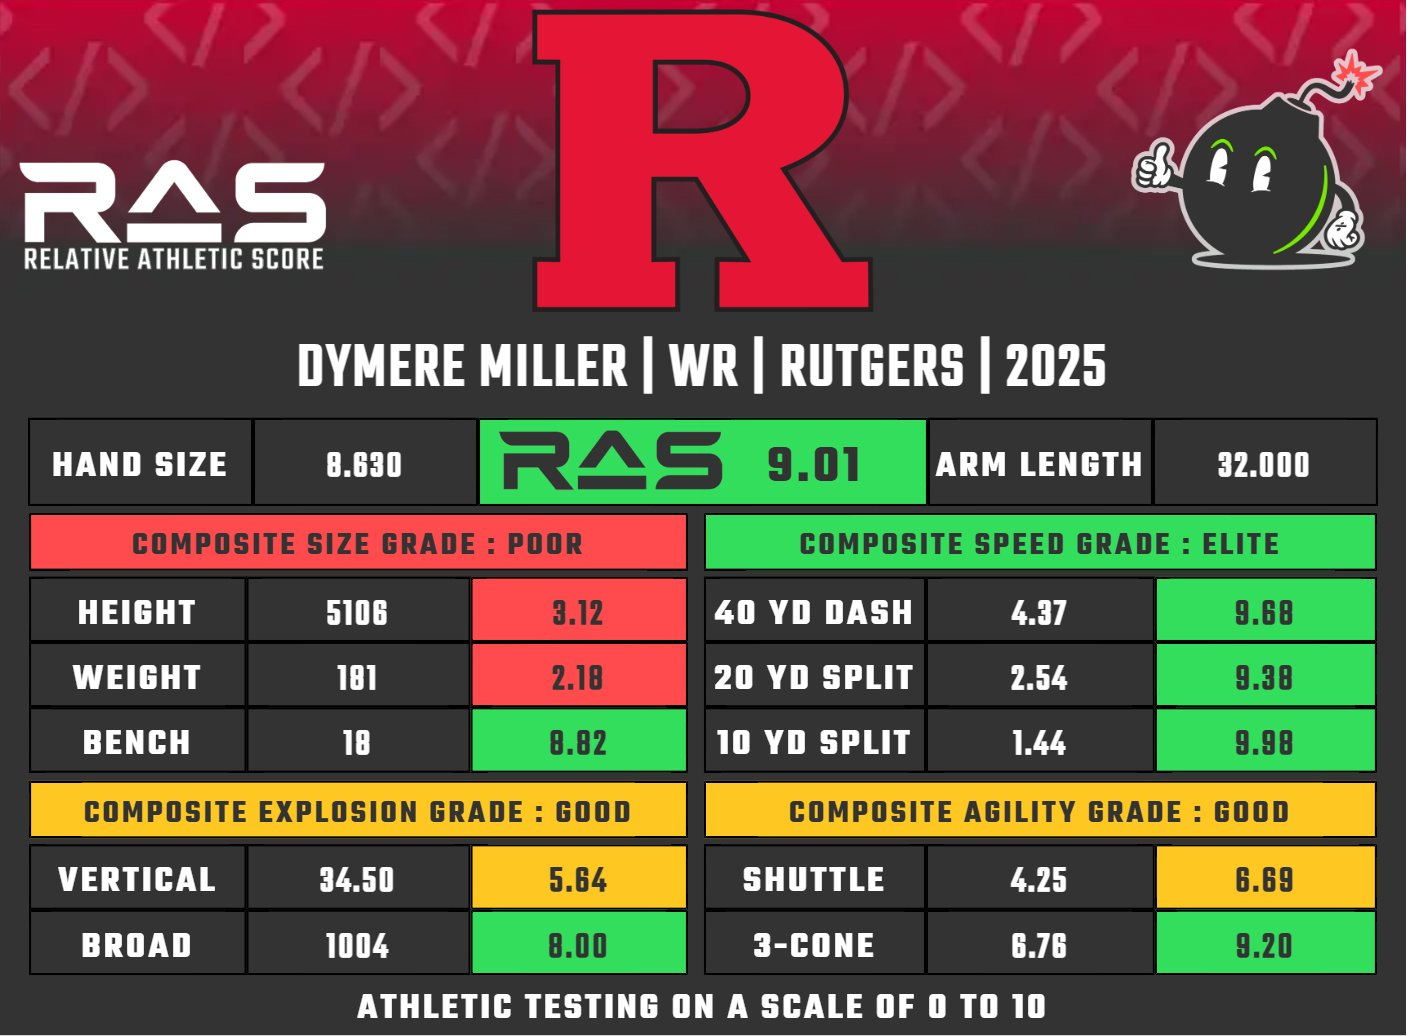
The last name in this group that I want to mention is Dymere Miller out of Rutgers. I have seen absolutely zero chatter on this guy, and he certainly deserves some. Miller broke Miles Austin's single-season receiving record during his time at Monmouth before transferring to Rutgers. Miller is a lean wide receiver known for his ability to gain yards after contact and quickly turn upfield. Miller’s YAC/RR is 1.25, which is an 88th percentile score.
Let’s see the draft capital.
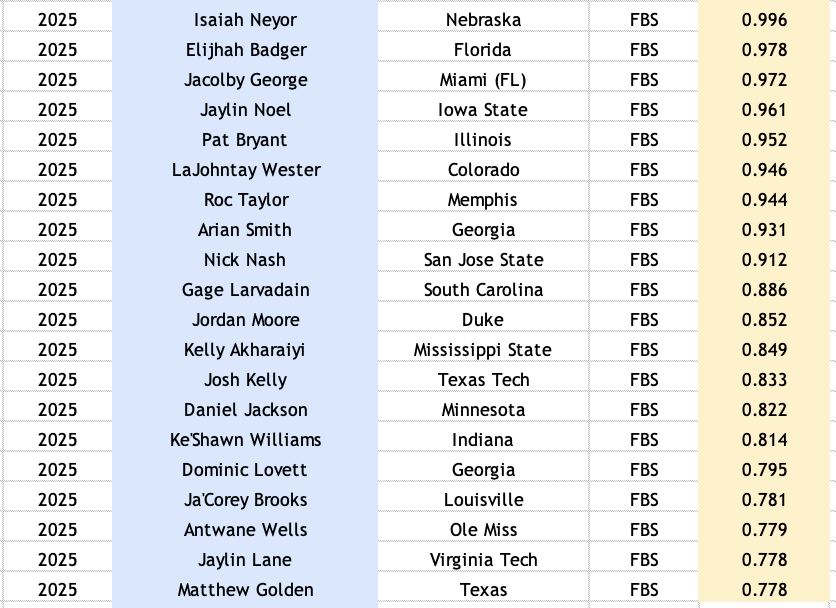
As mentioned above, this grouping of WRs with an ARIS score between .775 and 1.000 might suggest players who could be valuable depth options or potential breakout candidates (stashes). Their profiles leave a lot to be desired, but they have enough to them that in the right scenario, they could be successful. Isaiah Neyor is an athletic freak who suffered multiple injuries in college while playing for three different programs. Elijah Badger could be a day-three steal for a team and has become one of Scott Barrett’s favorite sleepers. Jaylin Noel has a great reception perception profile and is a projected day-two pick, but his college production leaves much to be desired. Louis Riddick has been praising Nick Nash’s name throughout the pre-draft process. Matthew Golden is a potential top-10 pick who had four good games in his career after his running mate, Isaiah Bond, got hurt. If Golden were to get drafted in round 1, he would fall into a very uninspiring group of wide receivers joining Jalen Reagor, Mike Williams, and Ricky Pearsall, with RD1 draft capital and an ARIS between .775 and 1.000.
As you can see, we can go through each player’s profile and raise questions. Let’s see the landing spots and the draft capital.
Probably best to avoid.
This is where I believe that ARIS really becomes useful. While this metric might not have the predictive power to tell us for sure who will be good, it does an excellent job of telling us who likely isn’t good. Since 2017, there have only been three wide receivers with a failing ARIS grade to have a 14 ppg season - Brian Thomas (straight miss), Courtland Sutton (last season), and Hunter Renfrow (one-year wonder).
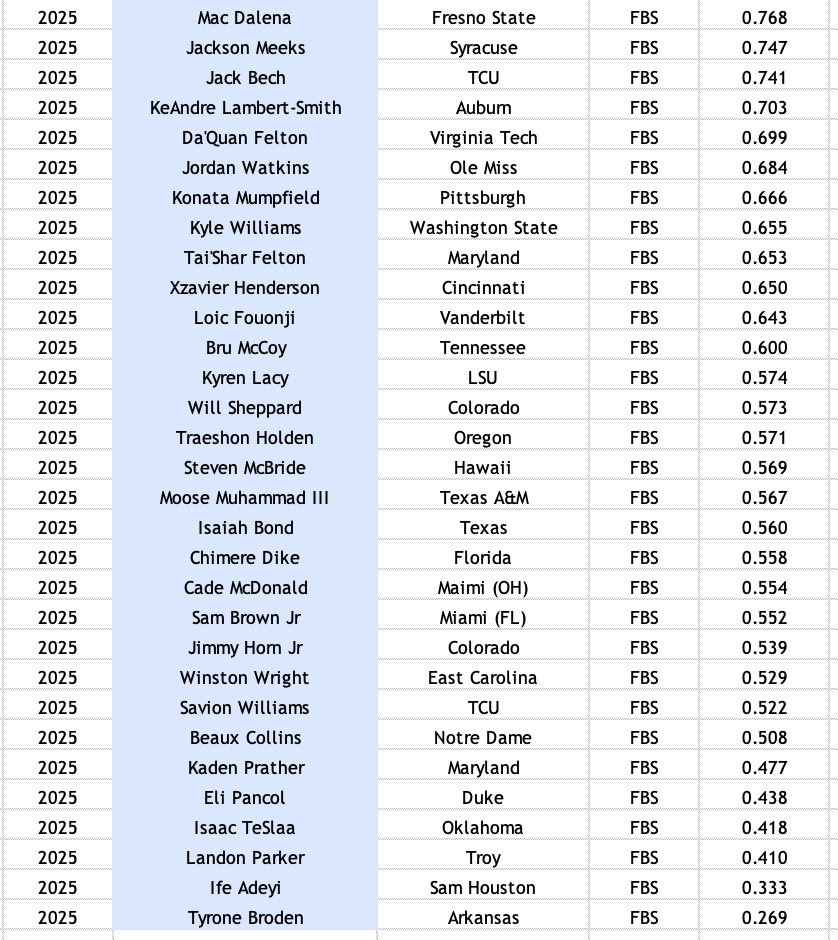
Some popular draft prospects that fail this metric include Jack Bech, Kyle Williams, Tai’Shar Felton, Isaiah Bond, Savion Williams, and Chimere Dike.
For starters, all six wide receivers have a career YRR and RYPTPA below 2.0. Since 2017, there have only been four wide receivers with career numbers below 2.0 to have at least one 14 ppg season.
The one WR from this class that can possibly fall into this bucket with day two draft capital is Jack Bech. However, his prospect profile carries a bunch of red flags within itself. Starting with his freshman season, his per-season numbers got worse in his sophomore season, and then he took another dip in his junior season before exploding in his senior season at TCU. As a general statement, seeing a player get progressively worse before breaking out as an older prospect against younger competition is a red flag. If I were to filter through some of the more important factors that go into ARIS, these are the other prospects within the same bucket.

The FCS WRs.

In terms of the FCS wide receivers, there doesn't seem to be a ‘Jalen Coker type’ prospect in this class (Coker scored a 2.050 ARIS). Using the thresholds I used last year, the two closest names I get are Jacari Carter from Albany and Takairee Kennebrew from North Alabama. Coker was a UDFA, so these guys are worth monitoring whether or not they’re drafted. Kennebrew is, unfortunately, a much older prospect at 25 years old, but he did dominate the Dream Bowl. Kennebrew has one of the highest ARIS scores ever, and Carter fails that metric.
Weighted Success Rate Over Expectation (WSROE)
Last year, I came across a discussion in the Reception Perception discord where someone mentioned doing a success rate over expected exercise with some of the prospects from the 2024 draft class. I was very intrigued, and I took it a step further and collected all of the prospect charts for college wide receivers and integrated them into my own version of this project. I collected data for all the different routes and success percentages dating back to 2018. This project aimed to find the Weighted Success Rate Over Expected, which measures how a player's success rate on various routes compares to what is typically expected. This helps determine if a WR is a good route runner compared to the average player.
WSROE takes the SROE (Success Rate Over Expectation) for each route and weighs it based on how often the player runs that route. For example, if a player runs a lot of slants and is very successful with them, that success will have a big impact on their WSROE. The formula involves multiplying the SROE for each route by the percentage of times that route is run by the player and then adding up those products for all routes.
For example, if a player runs slants 75% of the time with a success rate of 4% better than expected and runs nine routes 25% of the time with a success rate of 8% better than expected, their WSROE would be 5%. This means that, on average, the player's success rate is 5% better than expected across all routes they run, taking into account how often they run each route.
A high WSROE means the receiver is very effective at running their routes and making successful plays compared to what is typical for those routes. In contrast, a low WSROE means a player struggles to execute their routes successfully or just isn’t good at running routes.
For historical context, of the 96 prospects I have data for, 21 have produced at least one 14 ppg season since 2018. Of those 21, only three had a WSROE below zero: Michael Gallup, Amon-Ra St. Brown, and Rashee Rice. 7 of those 21 have a WSROE greater than 10 (80th percentile), which I consider to be an ‘elite’ or ‘high-end’ route runner.
Using WSROE alongside ARIS, we can add another layer of context to a WR's profile to help us determine who is and who isn't a good choice to draft during our rookie drafts.
Travis Hunter joins a very small group of prospects with both an elite ARIS and WSROE scores.
Jaylin Noel, Kyle Williams, and Jack Bech all placed above the 80th percentile mark. Last season, AD Mitchell was the first WR in the database with a WSROE above the 80th percentile mark and had a failing ARIS score (below .775). Bech and Williams join him as two other prospects with similar profiles. This is a volatile group, so I would be hesitant to draft either of these WRs. Still, it will be interesting to see how their careers play out over the next few seasons to see if there is any signal in this particular grouping.
Burden, Golden, McMillan, Horton, and Harris all posted good WSROE scores. Golden is projected to be drafted in round one and would join Ricky Pearsall as the only two WRs with an ARIS between .775 and 1.00, round one draft capital, and a good WSROE score. I was out on Pearsall last year due to his entire prospect profile being very underwhelming, and heading into his sophomore year, I remain out after a subpar rookie season. From my point of view, Golden is a much better prospect and could be worth the risk, but as of today, I still lean more pessimistically than I do optimistically about his outlook.
Egbuka and Ayomanor had 50th percentile scores and fell into a grouping with players like Josh Downs, Ja’Marr Chase, George Pickens, Jameson Williams, Christian Watson, and Courtland Sutton. I'm not worried about those guys, but development is needed if they want to expand their route tree.
Higgins and Royals fall into a group that is littered with red flags. While their ARIS scores might be above the 80th percentile mark, their WSROE score is closer to the 10th percentile mark, joining a group that includes - Tylan Wallace, Treylon Burks, Justyn Ross, Rondale Moore, Wan’Dale Robinson, Devontez Walker, Xavier Hutchinson, and David Bell. Given Higgins’ route running deficiencies but great analytical profile, it’s interesting to see Treylon Burks in this group with him. Red flag?
Like the aforementioned Higgins and Royals, Xavier Restrepo also has a very poor WSROE. His ARIS is above 1.000, which is good, but given the projected day three draft capital, his two closest comps within these two metrics are AT Perry and ARSB. Extreme bust or extreme boom. I'll bet against Restrepo becoming the next Sun God and label him as a clear avoid during rookie drafts.
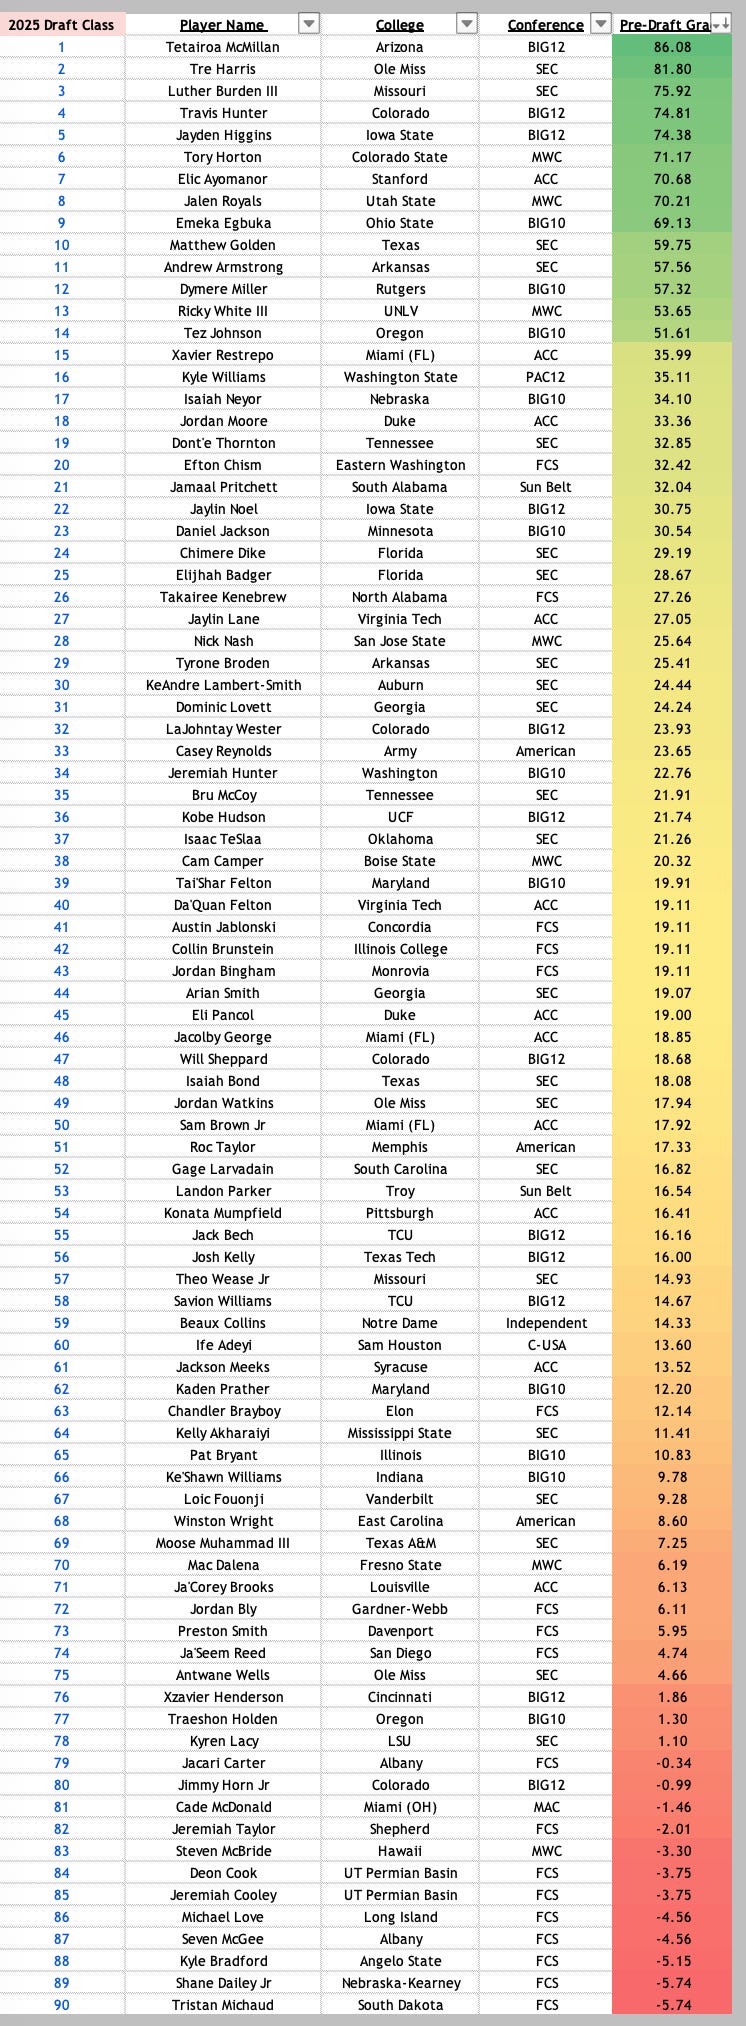
Pre-Draft WR Grades
These are the complete grades I have for the 2025 WR class. I do not weigh WSROE as a part of their grades; I just use it as an additional data point and something else to keep in mind when deciding who to take during my rookie drafts.
I do not have a set of personal rankings, and these grades do not reflect how I would potentially rank them. A custom film grade is built into all my models, so the grades reflect a more wholesome view of a prospect rather than just analytical figures.
For historical context, here are my top 75 pre-draft grades all time.
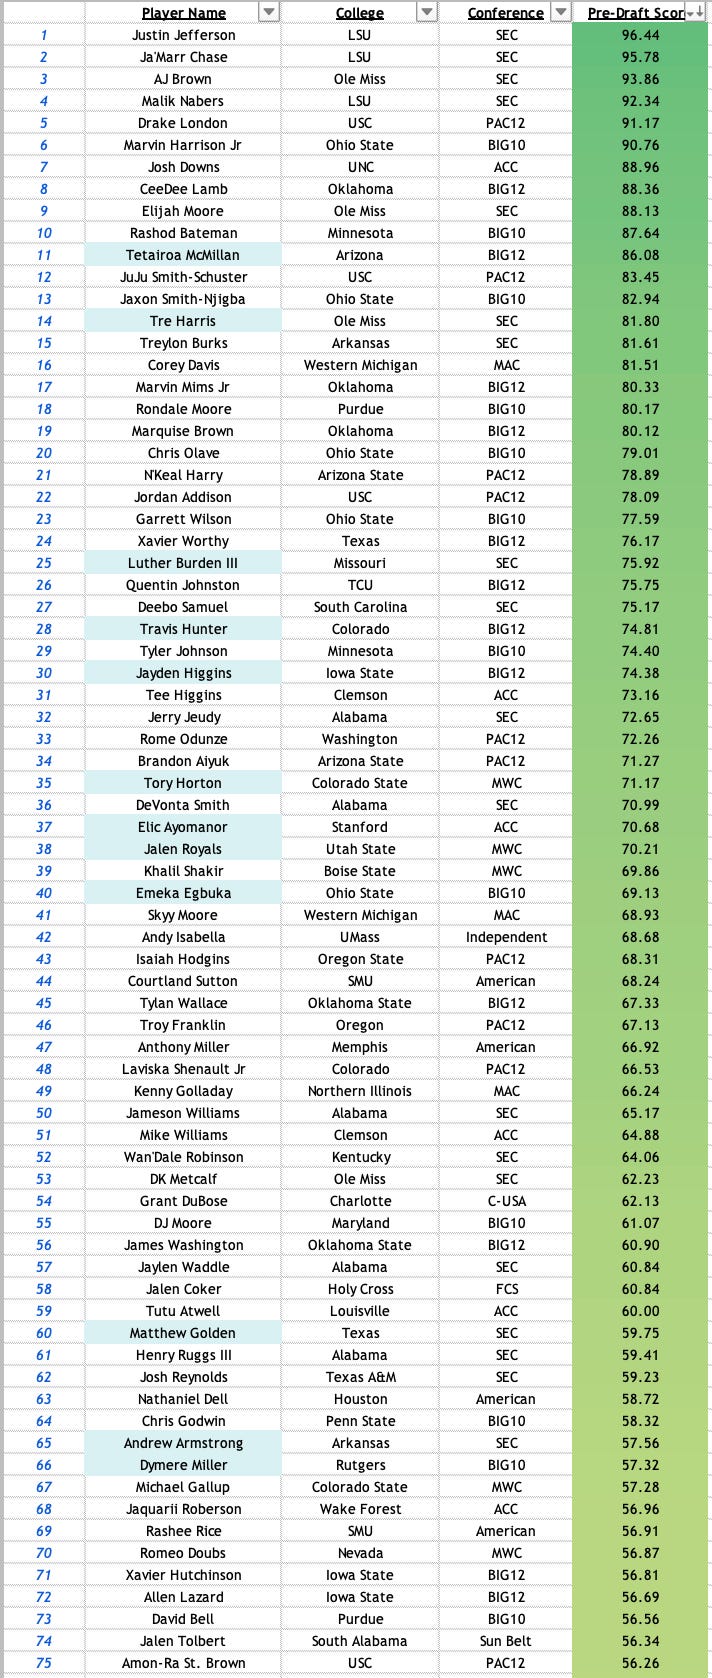
Draft capital is obviously a large piece of the puzzle, and grades will climb and fall with the results of the draft. I will have an update on my WR model in the following week(s) after the draft.
These are the final grades from last year's class for reference on what the post-draft grades might look like.
